
The IDEFICS/I.Family cohort data are a valuable resource for research on child and adolescent health in Europe. The dashboard provides insight into 379 variables from these data (a complete overview of all variables can be found here). They can be examined in aggregate form. The dashboard is available to interested parties after a simple registration. If you intend to analyze the data in more detail to answer a scientific question, please submit a data use request.
The accessible variables represent information from several survey waves (T0, T1, T3 and T5). They include:
- demographic information (e.g. age and country)
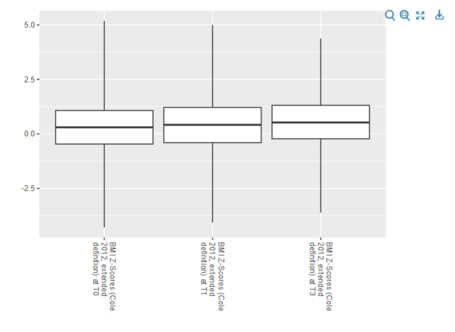
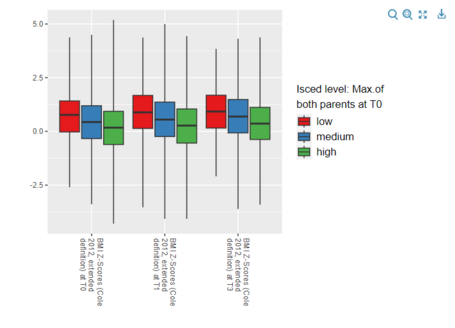
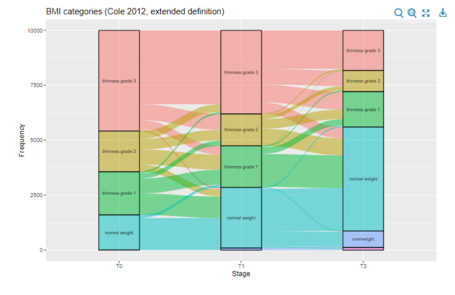
- anthropometric characteristics (e.g. height and BMI)
- lifestyle variables (e.g. diet and physical activity)
- laboratory values (e.g. glucose)
The analysis results in the tool are not based on the original data, but on synthetic data. Therefore, deviations from the original results are possible. It should also be noted that results based on only a few people are not shown.

Usage and accessibility
After a registration, this dashboard can be used to gain an impression of the IDEFICS/I.Family cohort data. If you would like to request access to the original data for research purposes, please use the dashboard to get an initial overview of the relevant variable available. You can log in or register for the dashboard here.
Data security
Several measures have been taken to ensure a high level of data security. The DataSHIELD infrastructure protects against the identification of individual data. For example, this guarantees that aggregated data can only be displayed if they are based on sufficiently large samples. If smaller case numbers are displayed, these are based on smoothed variables.
As an additional layer of security, the DataSHIELD server does not store the original data, but synthetic data. These give a good impression of the distribution of the actual variables, but due to their synthetic nature, do not allow any conclusions to be drawn about real study participants. A non-parametric copula-based approach was used for data synthesis. The marginal distributions were modelled using a spline-based density estimator. This allows flexible modelling of differently scaled variables and their dependencies.
References
Ahrens W, Siani A, Adan R, et al. Cohort Profile: The transition from childhood to adolescence in European children-how I.Family extends the IDEFICS cohort. Int J Epidemiol. Oct 1 2017;46(5):1394-1395j. https://doi.org/10.1093/ije/dyw317
Ahrens W, Bammann K, Siani A, et al. The IDEFICS cohort: design, characteristics and participation in the baseline survey. Int J Obesity. 2011;35 (Suppl 1): S3-S15. https://doi.org/10.1038/ijo.2011.30