
Can the online-tool also be used to assess individual measures?
Of course the respective percentiles for individual measurements can also be calculated. This is however only on condition that the age and sex of the child are given. For the calculation of the percentile value for blood pressure, the height also has to be given.
What will be shown graphically?
In the graph different percentile curves derived from the IDEFICS study will be shown for the variables (P1, P3, …, P97, P99). When a value measured on a child is entered in the respective input field, this will appear as a point on the graph, supplemented with a label reflecting on which point this value exactly lies. For example: If P87 is added behind the point, then this means that the child’s value lies on the 87th percentile, meaning that about 13% (87%) children of the same age have values above (below) this value.
Why can the MetS score only be calculated for children aged 3 to 10.9 years?
The percentile values were derived based on data from the IDEFICS study. At baseline (T0) and during the follow-up survey conducted two years later (T1), the study included children up to the maximum age of 10.9 years. Due to this, the tool cannot yet be used for older children (11+ years – it is however planned to enlarge the data in the context of further surveys (e.g. I.Family) so that percentiles for older children can also be derived. As percentile curves for children under 3 years could not be derived due to the small number of cases, the online-tool can only be used to calculate MetS scores from the age of 3 years.
Why does the entered value not appear on the graph, but instead the message “Input out of displayable range“?
The presentation of the percentile values depends on the age of the children (x-axis). The presented range of values on the y-axis results from the minimum and maximum values of the respective variables recorded in the IDEFICS study. If values outside this range are entered in the online-tool, the value will not be shown on the graph and the sign “Input out of displayable range“ appears on the upper margin of the picture.
For blood pressure values, why does the tool show percentile curves only for a small section?
As bigger children generally also have higher blood pressure values, in addition to age, height also has to be considered when deriving percentile values for blood pressure. This however leads to the fact that only certain age-groups can be shown on the graph – namely, those in which children with corresponding height are normally to be found.
The following example is supposed to illustrate this: Figure 3 shows the visualization of a measurement of systolic blood pressure of 110mmHg on a 6-year-old boy, who is 120 cm tall. The value is shown on the graph by means of a point marked P88 (and signifies that in comparison to other children of the same age and height, the value lies on the 88th percentile). Because in the group of boys who were 120 cm tall in the IDEFICS study, only a few were younger than 4.5 years or older than 8.5 years old, reliable reference values could also only be derived for the age-group in-between (4.5 – 8.5 years). This is what is accordingly reflected on the graph.


What is shown in the results window, what do the colored backgrounds for the 4 components mean, and how should the classification of the results into the categories ‘normal‘, ‘monitoring‘ und ‘action‘ be interpreted?
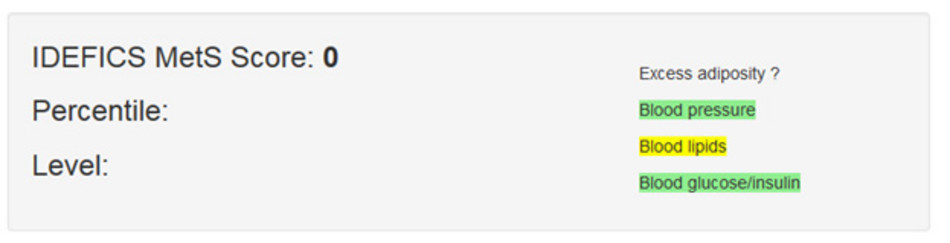
The Online-Tool calculates the sum of Z-Scores of different variables that are relevant for metabolic syndrome and shows the result on the upper left side in the results window as IDEFICS MetS Score. The percentile then appears below that, i.e. an estimation of how many children from the IDEFICS study had an identical or lower MetS score.

Figure 5 exemplarily shows the presentation of the measurement values in the results window. In this example the sum of the Z-scores for the IDEFICS MetS score for the child concerned was 4.9. To be able to evaluate this result, the information Percentile: 93 appears in the line beneath. This means that 93% of all children of the same age (same sex) had an identical or lower MetS score, respectively the other way round: only 7% of all comparable children, with regards to age and sex, had a higher MetS score. The risk estimation for metabolic syndrome indicated as Level in the line below refers to the four components of metabolic syndrome listed on the right side of the window. For each of the four components, the values measured on the child will be assessed using the Online-tool based on the reference values from the IDEFICS study and visualized using traffic light labelling.
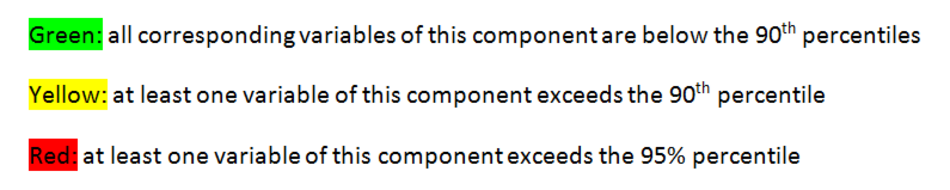
As three of the four components shown in this example lie above the 90th percentile, in the general overview it is recommended that, because of the measurement results, a close monitoring of the child is advisable (‚monitoring’, marked yellow). Should (at least) three of the four components exceed the 95th percentile, a pediatric intervention (‘action‘, marked red) is strongly advised.
At this point it should be explicitly pointed out that a classification of the MetS-risk as normal (Level: normal) simply means that a maximum of two of the four components exceed the respective 90th (see figure 6).

This should not be taken to mean that no action whatsoever is required on such a child. Figure 6 exemplarily shows the results window of the measurements of a child with an extremely elevated waist circumference (>95th percentile) and high blood pressure (>95th percentile). As the lipids and glucose values are however unremarkable (<90th percentile), in the general overview of the measurement results the tool estimates the risk for metabolic syndrome as ‘Level: normal‘.
What does a question mark after one of the components on the right side of the results window mean?
For each of the four components, the evaluation of the child’s measurements based on the online-tool, will be visualized on the right side of the results window using traffic light labelling. In case the required variable for the characterization of the component has not yet been entered, a question mark appears after this component.
Why are the BMI percentile curves presented according to Cole & Lobstein (2012)?
In order to obtain an estimate of the risk for metabolic syndrome, the risk factor for adiposity in our online-tool is classified based on the child’s waist circumference. To however also be able to evaluate the child’s BMI, the tool additionally offers the possibility to compare this to one of the internationally established reference systems (Cole TJ, Bellizzi MC, Flegal KM, Dietz WH. Establishing a standard definition for child overweight and obesity worldwide: international survey. BMJ 320, 1240-3.). The original publication from the year 2000 that has meanwhile been cited more than 7 000 times, was revised in 2012 and percentiles can now also be calculated and presented (Cole TJ, Lobstein T. Extended international (IOTF) body mass index cut-offs for thinness, overweight and obesity. Pediatr Obes. 2012 Aug;7(4):284-94.).
Should you wish to compare the calculated BMI to another reference system, we recommend the use of the Ped(z) Kinderarzt Rechners (https://www.pedz.de/de/bmi.html).
What therapy options are available if the test indicates an elevated risk for metabolic syndrome?
The treatment of a child with an elevated MetS-risk should obviously be individually compiled and concomitantly monitored by the attending doctor. An overview of treatment options is to be found online on the internet page of the Professional Association of German Internists (Berufsverbands Deutscher Internisten e.V.):
www.internisten-im-netz.de/de_metabolisches-syndrom-behandlung_652.html